


Civil Engineers Salary Analysis in 2024 PART 1
Comparing yearly wages across countries and sub-disciplines

Here’s the deal, the reddit.com/r/Civilengineering subreddit has a salary survey that people in the civil engineering industry can fill out voluntarily. Any average Joe can look at this data and see what the trends look like for the industry.
Found here: https://www.reddit.com/r/civilengineering/comments/162thwj/aug_2023_aug_2024_civil_engineering_salary_survey/
There’s so much data packed into these surveys, from basic information like salary, years of experience, and gender, to more qualitative questions like job satisfaction, and how many days people work from home.
This analysis, based on survey data, will be divided into three parts:
Part 1 will explore the top-paying countries for civil engineers and compare salaries across sub-disciplines.
Part 2 will examine work hours per week in various states and provinces, job satisfaction across sub-disciplines, and comparisons of salary and parental leave by gender.
Part 3 will analyze the impact of years of experience and education level on salaries in the United States. It will also investigate trends in starting salaries across sub-disciplines from 2021 to 2024.
The figures presented here are from various countries; in the survey the question asked is “what is your annual salary?”. The assumption is that people reported annual salary in local currencies (CAD for Canada, USD for the USA, etc).
Let's start by looking at the salary trends at the country level before zooming in on specific sub-disciplines within a few selected countries.
1. Country-Level Salary Comparisons
Let’s filter the data by country, showing the mean, median, top and bottom salary for each country:

This is clearly too much to easily compare. The next step is to filter by sample sizes greater than 2.
ChatGPT Interpretation:
Looking at the country-level salary distribution, we see some interesting patterns. Hong Kong, United States, and Switzerland emerge as the countries offering the highest mean and top salaries. In contrast, countries like Nepal and Sri Lanka show much lower figures, which might be reflective of their economic conditions and the local demand for civil engineering skills.

Hong Kong has an exceptionally high top salary, reaching over 600,000, which could be indicative of significant opportunities for high-earning professionals in specialized roles.

The United States and Switzerland also show strong mean and median salaries, making them attractive markets for civil engineers.

On the lower end, Nepal and Sri Lanka show salaries that are significantly below the global average, suggesting a lower demand or economic capability in these regions.

The data also highlights the importance of considering the cost of living and currency strength. For example, while salaries in the United States are high in absolute terms, the purchasing power of USD can make these roles particularly lucrative compared to similar positions in other countries. 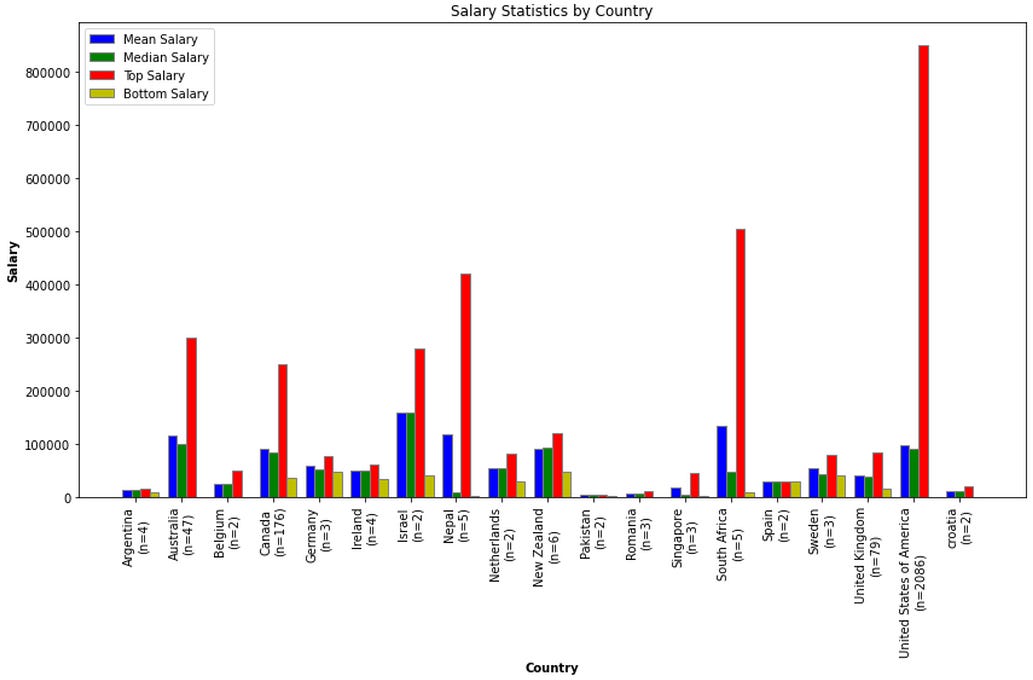
Now we’re getting somewhere!
The USA has the most respondents in this survey (at n=2086), followed by Canada (n=176), the UK (n=79), and Australia (n=47). Not surprising that most people on reddit are from English speaking countries.
Let's increase the filter to n=>5, which filters to at least 5 respondents from a given country.

Wow, Nepal made the list! It looks like Nepalis are quite active on Reddit.
The above figure shows US top earners leading the charts; when comparing the salary of countries to USD this ratio gets even better for the states.
The next chart will flatten the graph by removing the top and bottom earners and showing the multiple conversion to USD for each local currency.

Now here’s some interesting data. The ranking of country mean salary from best to worst are as follows:
United States
Australia
Canada
5. United Kingdom or New Zealand
South Africa
Nepal
Median salary in the survey follows closely with the mean except for Nepal, and South Africa. A limited number of samples or outlier data points can impact the discrepancy between the mean and median bars. 2. Sub-Discipline Salary Insights by Country
Next, let's take a closer look at how different sub-disciplines within civil engineering fare in terms of salaries across Australia, Canada, the UK, and the USA.
a. Australia Salary Statistics by Sub-Discipline in 2023-2024.


In Australia, Construction Field and Transportation sub-disciplines offer the highest top salaries, reflecting strong demand in these areas. Structural and Water Resource also show slightly lower mean and median salaries. The sample sizes for these values are limited and the number of years worked are not taken into consideration in these charts, but that will be discussed in part 3.
b. Canada Salary Statistics by Sub-Discipline in 2023-2024.


In Canada, Water Resources and Geotechnical roles also offer the best top salaries, although with a wider range between the top and bottom salaries. This suggests that while these fields are lucrative, there may be greater variability in pay, possibly due to regional demand or varying levels of experience among professionals. Bridges and Environmental are leading the pack in terms of mean salaries. Structural is in last place for mean and median salaries, while middle of the pack in terms of top earning salary. This suggests that the starting salary for structural in Canada is not very high compared to other sub-disciplines but trends upwards with experience.
c. United Kingdom Salary Statistics by Sub-Discipline in 2023-2024.


In the UK, Bridges and Construction/Field sub-disciplines show the highest top salaries, while Water Resources and Land Development offer more moderate earnings. Interestingly, the median salaries are relatively close across all sub-disciplines, which might suggest a more standardized pay structure within the industry.
d. United States Salary Statistics by Sub-Discipline in 2023-2024.


The United States presents a diverse salary landscape, with Structural leading every other sub-discipline by a wide margin in terms of top salaries. It’s likely that these top salary earners are business owners, to generate annual salaries of $800k+.
Construction and Government also show the highest mean salaries for this period. This implies that a lot of funding from the public sector is currently active in the US markets, and that construction is also in demand.
Part 2 will discuss some of the more qualitative measurements of working in the civil engineering industry, like job satisfaction and salary differences based on gender.